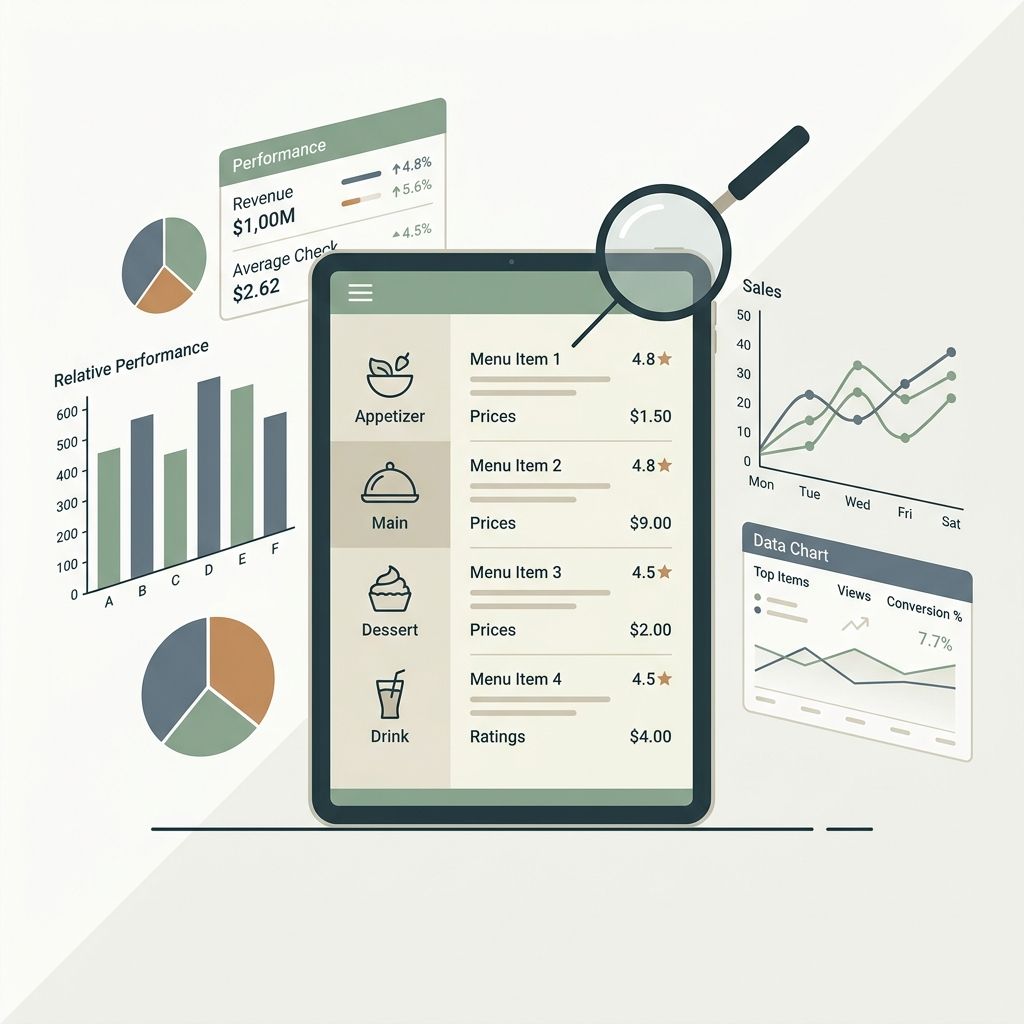
# The Ultimate Guide to Restaurant Menu Analytics in 2026
For decades, restaurant owners relied entirely on intuition and point-of-sale (POS) reports to make decisions. You knew what sold at the end of the day, but you never knew *why*. You didn't know how many people looked at the $40 steak and decided against it. You didn't know which categories guests spent the most time browsing.
In 2026, relying purely on sales data is no longer enough. The most profitable operators are using in-store analytics for restaurants to track customer behavior *before* the order is placed.
By leveraging modern restaurant menu software, you can finally unlock the "black box" of customer decision-making, optimize your pricing, and dramatically increase your profit margins.
Why POS Data is Only Half the Story
Your POS tells you the final score of the game. It tells you that you sold 45 burgers and 12 salads. But it doesn't tell you the story of how the game was played.
Consider this scenario:
Your POS reports show that your new signature pasta dish is barely selling. The old-school reaction is to remove it from the menu. However, your restaurant analytics reveal that the pasta dish is actually the second most-viewed item on your digital menu—but it has a 0% conversion rate.
This completely changes the diagnosis. The problem isn't that customers aren't interested; the problem is likely the price, the photography, or the description. Without digital menu analytics, you would have thrown away a highly popular concept instead of simply tweaking the price tag.
Key Metrics to Track in 2026
When evaluating digital menu design software, ensure the platform provides detailed insights into these three critical areas:
1. View-to-Order Conversion Rate
This is the holy grail of menu analytics. By tracking how many people tap on an item to read its description or view its photo, compared to how many actually order it, you can identify your "leaky buckets." If an item gets high views but low orders, it usually means the price is too high or the description is unappetizing.
2. Dwell Time (Category Engagement)
How long do customers spend looking at your "Starters" section compared to your "Mains"? If guests are spending 60 seconds browsing appetizers but only 10 seconds on desserts, you know exactly where to put your most profitable add-ons.
3. Multi-Location Restaurant Analytics
If you run a franchise or chain, what sells in one neighborhood might fail in another. Robust multi location restaurant analytics allow you to compare the performance of specific dishes across all your branches simultaneously from a single dashboard.
Traditional vs. Data-Driven Menu Management
To understand the shift happening in 2026, let's compare the traditional approach to a data-driven strategy powered by modern restaurant menu software.
| Strategy | Traditional (PDF/Paper Menus) | Data-Driven (MenuClips) |
| :--- | :--- | :--- |
| Pricing Adjustments | Guessed based on food costs | Optimized based on view-to-order ratios |
| Item Removal | Removed if sales are low | Removed only if views AND sales are low |
| Menu Layout | Static, updated seasonally | Dynamic, optimized for high-dwell zones |
| Customer Insights | Relies on waitstaff feedback | Real-time, exact behavioral tracking |
*If you are still using PDFs, we highly recommend comparing the best digital menu software for restaurants to find a solution that offers built-in analytics.*
How to Get Started with In-Store Analytics
You don't need to hire a data scientist to start optimizing your menu. The transition is incredibly simple:
1. Ditch the PDF: You cannot track behavior on a static PDF. You must upgrade to a responsive, HTML-based digital menu.
2. Launch with Professional Photography: Visuals heavily skew analytics. Ensure your baseline data is accurate by launching with great imagery.
3. Wait 30 Days: Let your customers interact with the new menu for a month to gather a statistically significant amount of data.
4. Make Micro-Adjustments: Don't rewrite the whole menu. Change the price of one high-view/low-order item, or move a high-margin item into a high-dwell category, and watch the data shift.
For a deeper dive into optimizing specific dishes, read our guide on understanding your most popular items.
---
Frequently Asked Questions (FAQ)
Q: Do I need technical skills to read restaurant analytics?
A: Not at all. Modern platforms like MenuClips present data in simple, visual dashboards designed specifically for busy restaurant owners, not data engineers.
Q: How quickly can I see results from changing my menu based on data?
A: Because digital menus update instantly, you can often see changes in customer ordering behavior during the very next dinner service.
Q: Is it expensive to get software with multi-location analytics?
A: It used to require expensive enterprise POS systems. Today, digital presence platforms include advanced multi-location analytics in their standard tiers, making it affordable for independent operators and small chains.